
The Timeliq product
Connect your data, create dashboards you can edit and put them to work across your business. Timeliq combines reporting, access and AI questions in one workflow.
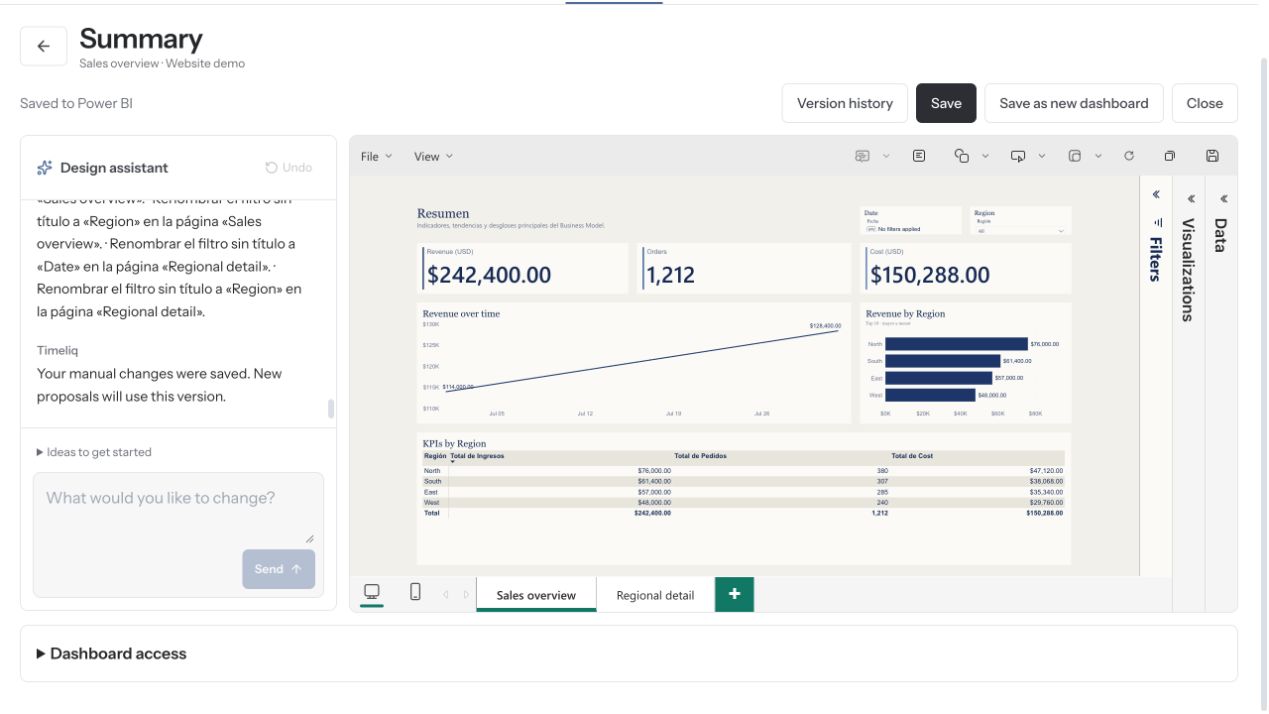
Timeliq product demo · Sample data
Start with the information you already have. Create a useful first view, then keep improving it.
01
Bring supported business data from your files into a repeatable reporting workflow.
02
Connect an online workbook through OneDrive and refresh the reports built around it.
03
Prepare a shared structure for your tables and metrics. Supported data is modeled automatically; complex cases may need review.
04
Dashboards from a prompt
Describe the metrics and views you need, then use the generated report as your starting point.
05
Visual report editing
Change charts, fields, filters and layouts without writing code. Ask AI for another change when it helps.
06
Saved reports and refreshed data
Keep your work, refresh compatible connections or replace an uploaded file without starting the design again.
Portal · included in Timeliq
Bring your reporting together in a catalog people can actually navigate. Give colleagues or clients access to the right reports, and keep separate client workspaces under one account when using Partner.
Organize access around the people who need the report—not a chain of forwarded links.
Invite users, define roles and choose which reports they can use. Microsoft 365 sign-in is available for work accounts.
Portal is not another subscription. It is part of every Timeliq plan.
Illustrative example · Sample data
Report catalog
Connect the people, channels and reporting assets that are already part of your business.
01
Ask questions about your connected model and follow up when you need a different breakdown.
02
Let authorized users ask business-data questions from the channels where they already work.
03
Bring authorized Power BI reports and semantic models you already own into the Timeliq experience. External permissions and licensing requirements depend on your setup.
04
Use work-account authentication together with Timeliq invitations and access permissions.
05
Decide who administers the space, who creates reports and who views them. Validate access for each connected channel.
06
Partner gives you five workspaces for organizing client reporting with pooled account allowances.